
A new study on behalf of Manifest Law has identified the cities with the highest wages for H-1B visas.
The H-1B visa program, a crucial path for skilled foreign workers in U.S. industries, is poised for significant regulatory changes, including a new $100,000 fee for applications made outside the U.S. and higher prevailing wage standards. Researchers at Manifest Law, a modern immigration law firm specializing in employment-based visas and global talent mobility, analyzed recent H-1B wage data, offering a valuable look into the current compensation landscape just as these impending changes are expected to reshape employers’ demand and strategies for global talent acquisition.
The Impact of the H-1B Visa
While frequently associated with technology and engineering sectors, the H-1B visa program spans a range of fields, including healthcare, academia, and finance. The program allows American employers to hire foreign workers in specialty occupations requiring theoretical or technical expertise. H-1B visas are particularly concentrated in industries that depend on advanced education and highly specialized skill sets, making the program a central pillar in many companies’ global talent strategies.
The continued reliance on H-1B workers reflects persistent skills gaps in the U.S. workforce. Employers frequently turn to this visa category when they are unable to find qualified domestic candidates, especially for roles requiring advanced degrees in science, technology, engineering, or mathematics.
As such, the program not only supports business innovation and service delivery but also points to long-term challenges in the domestic labor pipeline, including shortfalls in workforce development, higher education output, and training programs aligned with in-demand fields.
Researchers at Manifest Law, a technology-enabled law firm focused on helping clients with work visas, analyzed newly certified H-1B wage data to identify where these workers are earning the most, which companies are offering the highest wages, and how wage trends differ by occupation and geography.
Understanding H-1B wage patterns offers insight into how U.S. employers value specialized skills in a competitive global labor market. It also highlights which sectors and regions are most willing, or most required, to offer premium compensation to fill roles that may otherwise go unstaffed.
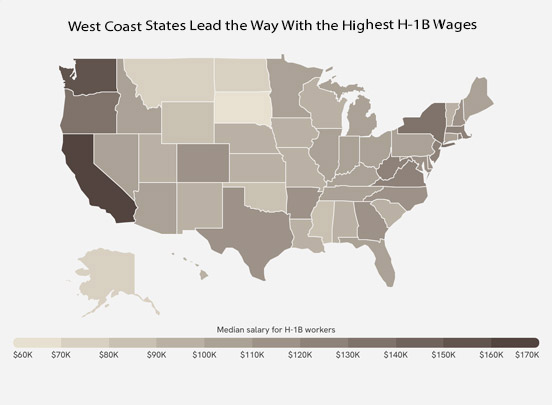
Where Are H-1B Wages the Highest?
H-1B wages are highest in the three West Coast states, California ($167,534), Washington ($157,600), and Oregon ($138,086), each reporting median annual wages well above the national median of $123,828.
These elevated wages reflect both the concentration of high-paying industries such as software, semiconductors, and cloud computing, as well as the high cost of living in coastal metropolitan areas. By contrast, the lowest H-1B wages are concentrated in the Northern Great Plains region, with South Dakota, North Dakota, and Montana all with median H-1B visa wages under $80,000 per year.
At the metro level, nearly all of the top-paying large metros (populations of 1M+) are located in established tech hubs. Anchored by industry giants like Google, Apple, and Meta, California’s San Jose and San Francisco metro areas top the list with median H-1B wages of $184,772 and $173,638, respectively. Seattle, headquarters to both Amazon and Microsoft, follows closely behind at $158,691.
However, these tech capitals are surprisingly outpaced by several small metropolitan areas (populations under 350,000). Driven by high demand in the healthcare sector, areas such as Parkersburg, WV; Beckley, WV; Jacksonville, NC; and Lake Havasu City, AZ all report median H-1B wages exceeding $315,000.
Top H-1B Wages by Occupation and Company
Speciality physicians and tech companies have the highest H-1B wages
.jpg)
Source: Manifest Law analysis of U.S. Department of Labor data (Photo courtesy: Manifest Law)
In addition to geographical disparities, H-1B wages also vary significantly by occupation and employer. Among all occupations with at least 100 certified H-1B applications, specialty physicians receive the highest average wages. Five medical occupations—cardiologists, anesthesiologists, radiologists, surgeons, and neurologists—report median H-1B wages exceeding $300,000, with some surpassing $400,000. These figures reflect both the advanced training required for these roles and the persistent demand in U.S. healthcare systems for board-certified specialists.
Among employers, technology companies dominate the list of top-paying firms for H-1B workers. Among the top 15 highest-paying firms for H-1B wages, 12 are tech companies, led by the streaming television company, Roku, offering a median of $376,579 for their H-1B employees. Major tech companies, such as Netflix ($226,158), Airbnb ($223,634), LinkedIn ($218,772), and Nvidia ($217,451), also top the list.
These companies are concentrated in high-cost, innovation-driven industries and are competing aggressively for specialized talent in fields such as software development, artificial intelligence, and robotics. The presence of these firms at the top of the wage rankings underscores the premium placed on technical expertise in today’s digital economy.
Changes in H-1B Applications Over Time
The H-1B approval rate is at its highest level in more than 15 years
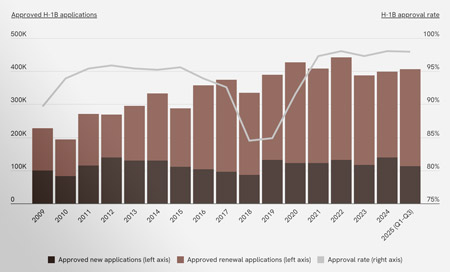
Source: Manifest Law analysis of U.S. Citizenship and Immigration Services data (Photo courtesy: Manifest Law)
These wage patterns take shape alongside notable shifts in application volume. Total H-1B visa approvals rose to over 442,000 in 2022, the highest in more than 15 years. This marks a strong recovery from the late 2010s, when approvals dropped below 340,000 amid increased scrutiny of visa applications and tighter adjudication standards. The approval rate has followed a similar trajectory, climbing from a low of 84.5% in 2018 to 98.0% in 2022. While the dip in the late 2010s marked a period of tighter enforcement, approval totals and approval rates have since stabilized near historical highs, indicating a return to pre-2017 patterns and an increased demand for labor in H-1 B-reliant sectors, such as tech and the sciences. Through Q3 2025, approved H-1B applications totaled 406,348 with an approval rate of 97.9%.
However, the environment for H-1B approvals is set to undergo significant change. The landscape for new H-1B petitions faces the possibility of sharp contraction, primarily driven by the $100,000 one-time fee for new applications made from outside the United States, effective as of September 21, 2025.
This financial barrier, coupled with pending rules to significantly raise prevailing wage levels, a benchmark used to determine the minimum wage for each H-1B worker’s occupation and location, and a proposed wage-weighted lottery prioritizing highly-paid workers, could collectively dampen demand and reduce the overall volume of new filings. These shifts could incentivize employers to fill roles domestically, adopt automation solutions, or more heavily rely on renewing existing H-1B visas, which will not be affected by these changes.
Here is a summary of the data for New York-Newark-Jersey City, NY-NJ-PA:
For reference, here are the statistics for the entire United States:
Methodology
Researchers at Manifest Law analyzed data from the U.S. Department of Labor’s Foreign Labor Certification Performance Data in order to determine the cities with the highest wages for H-1B visas. Using data from 2025 Q1-Q3, the latest data available, the researchers ranked locations by the median annual wage for certified H-1B visa applications. Because H-1B prevailing wage rules require employers to pay H-1B workers the higher of either the actual wage paid to similarly qualified U.S. workers at the company or the prevailing wage for the occupation in that geographic area, the wage for each application was determined using the average wage paid to nonimmigrant workers at the business and the prevailing wage for the geographic area, whichever was higher. Researchers also calculated the annual wage range for H-1B workers using the annualized wages at the 25th and 75th percentiles, the total number of H-1B applications, and the largest company sponsored by H-1B worker count.
For relevance, H-1B applications with anomalous or incomplete data were omitted, and metropolitan areas were grouped into the following population cohorts: small (less than 350,000), midsize (350,000–1,000,000), and large (more than 1,000,000).